
Droste Effect
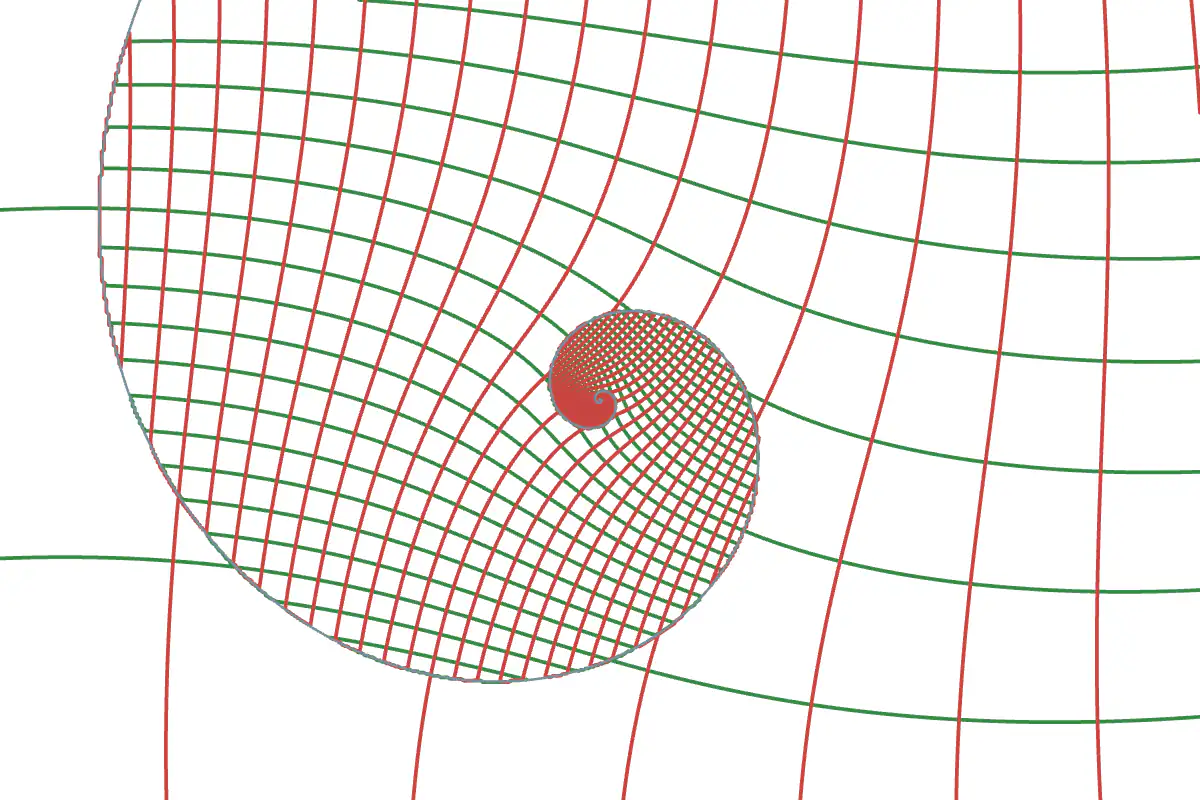
A square grid wound into a spiral that holds a turned, smaller copy of itself without end: the conformal map behind Escher's Print Gallery. The picture zooms into itself.
The Droste effect is a picture that contains a smaller copy of itself, which contains a smaller copy again, without end. It is named after a Dutch cocoa tin whose label showed a nurse holding a tray with the same tin on it. In his lithograph "Print Gallery" (1956), M. C. Escher bent such a picture into a spiral: a young man looks at a print of a harbour town, and the town holds the gallery where he stands. In 2003 the mathematicians Hendrik Lenstra and Bart de Smit showed that Escher's grid is a conformal map built from the complex logarithm and exponential: it turns a straight picture that repeats at a scale of 256 into a picture that repeats at a scale of about 22.6, turned by about 158°.
This document applies the same map to a square grid. Start from the ring 4 \le |Z| < 4k of the grid lines \sin(\operatorname{Re} Z) = 0 and \sin(\operatorname{Im} Z) = 0 . For each point z = x + iy of the plot, the document computes Z = 4\exp(a\ln z + T\ln k) with a = 1 - i\kappa and \kappa = \ln(k)/2\pi , and takes the real part of the exponent modulo \ln k , so that Z stays in the ring. With L = \ln|z| and \theta = \arg z , the exponent is (L + \kappa\theta) + i(\theta - \kappa L) : U is its real part after the modulo, W its imaginary part, and P and Q are the real and imaginary parts of Z .
The value of a makes the spiral. One turn around the centre adds 2\pi i to \ln z , and a \cdot 2\pi i = 2\pi i + \ln k : a full turn of Z , plus one period of the modulo. So one turn around the centre takes you to the next copy of the ring, k times smaller or larger. In the plot, the picture repeats at a scale of k^{1/(1+\kappa^2)} , turned by \kappa\ln k/(1+\kappa^2) : about 7.6 times and 43° for k = 10 . The map is conformal, so the grid lines still cross at right angles everywhere. The square grid does not look the same after a scale of k , so the edge of each copy shows as a seam. All the seams together are one logarithmic spiral, drawn in grey.
After a Desmos graph by Fabrice Neyret, itself after his Shadertoy shader and an article by Jos Leys on the Droste effect.
JavaScript is required to view the interactive plot.