
Buddhabrot
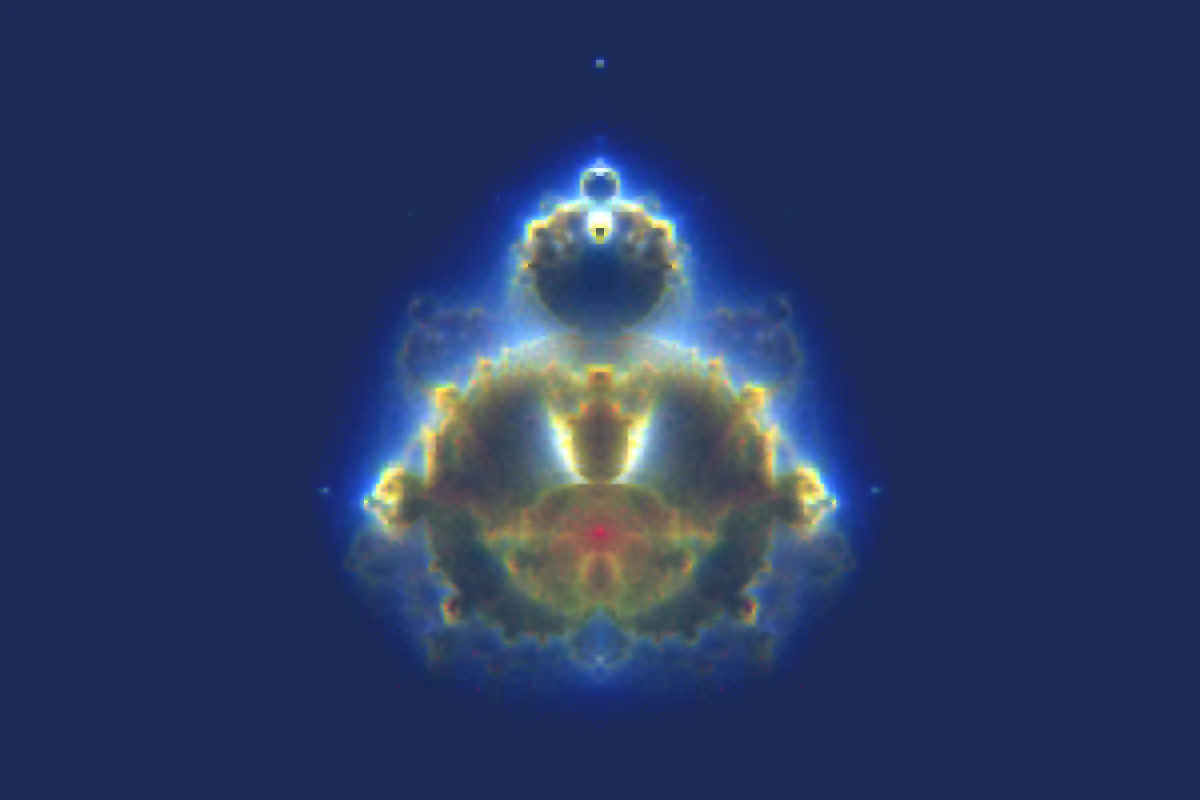
The Buddhabrot in three colors: 1.2 million points add their escaping orbits to three grids of counts, computed by the prelude when the document opens. Edit the step or the number of points.
The Buddhabrot uses the iteration of the Mandelbrot set, z \to z^2 + c , in another way. It takes many values of c and keeps only those that escape. It then marks each point on the path of z , and counts how many paths cross each cell of a grid. The bright lines are the places that the escaping paths visit most often. The picture is turned a quarter turn, with the real axis upright, and the shape looks like a seated figure, which gave the fractal its name.
This document counts the paths three times, by how fast they escape: red counts the paths that escape in at most 5000 iterations, green those that escape in at most 500, and blue those that escape in at most 50. So the slow paths of the figure show in red and yellow, and the fast paths around it make a blue haze. This color version is often called the Nebulabrot.
The document keeps the three grids in one list H_1 : the cell at column i and row j is H_1[1 + i + 150j] in the first grid, H_1[30001 + i + 150j] in the second and H_1[60001 + i + 150j] in the third, and the last element holds the number of points. The prelude of the document computes the list when the document opens: H_1 = \operatorname{step}(H_0, 1200000) counts the first 1.2 million points, in about half a second on a recent computer. The function \operatorname{step} takes its values of c from a fixed sequence, so it needs no random numbers and the same document always gives the same picture. It iterates each c up to 5000 times to see if it escapes, and then iterates it again to count its path. The Mandelbrot set is not in the picture directly: a value of c in the set never escapes, so it adds nothing.
Three shortcuts make the step faster. A value of c in the main cardioid or in the disc of radius \frac14 around -1 is in the set, and two exact tests find it before any iteration, so the step skips it. A path that comes back to a point it already visited repeats itself and never escapes, so the step stops it. The figure is symmetric about the real axis, because the path of the conjugate \bar c is the mirror image of the path of c , so each point of a path also counts in the mirror cell.
The formulas divide each cell by the number of points, so the colors do not depend on that number: the ratio goes to a fixed limit, and more points only lower the noise. On this grid, 1.2 million points are enough. To add more, change the number in the prelude.
JavaScript is required to view the interactive plot.