
Mandelbrot Colorings
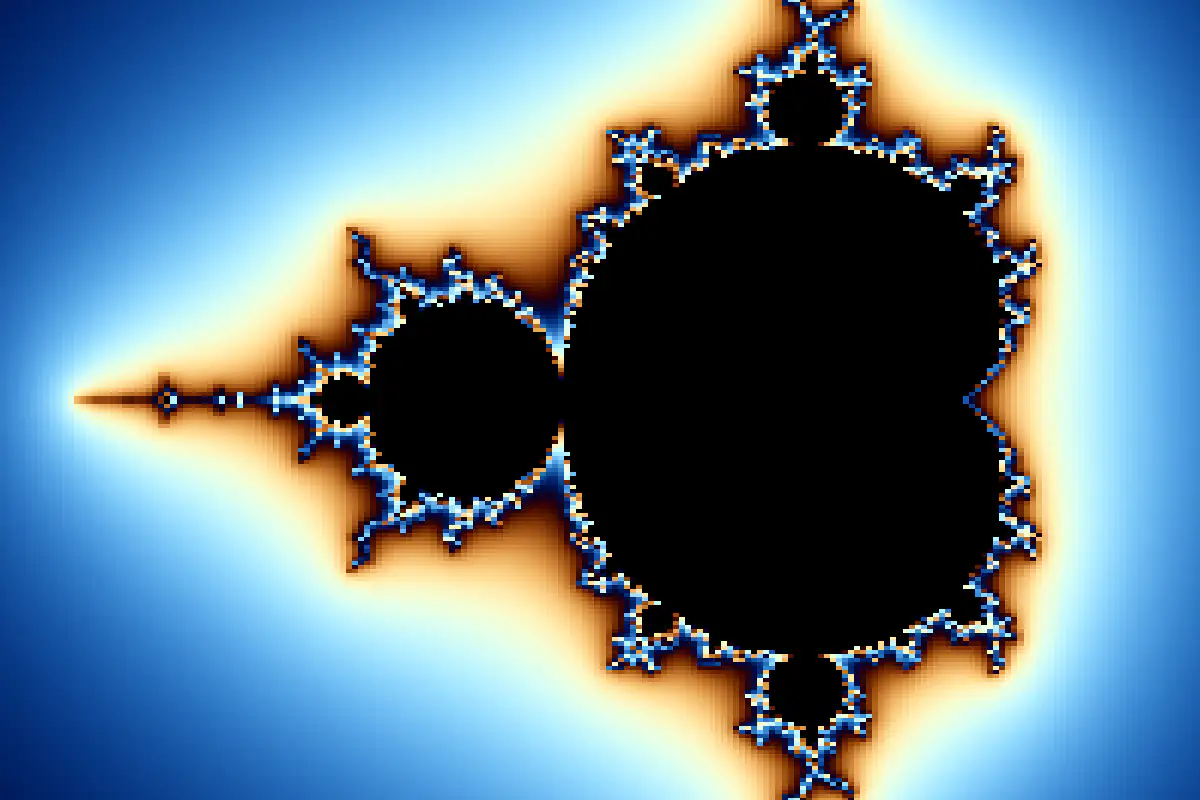
One equation, seven color formulas: change a slider to recolor the Mandelbrot set with cosine, polynomial, band and parity colorings. Edit each formula.
The picture of the Mandelbrot set comes from one number per pixel: how quickly the iteration z \to z^2 + c escapes. The colors are a separate choice, and this document shows seven formulas for the same equation. Change m to compare them. Each one is a formula that you can edit.
In the color formula, z is the value of the row, the smooth escape count divided by 256. It equals 1 inside the set. In this view, 90% of the pixels outside the set have a value below 0.033 , so a linear color map shows them in a small part of its range. The helper L(v) = \ln(1 + 256v)/\ln 257 spreads those values over [0, 1] on a log scale. The formulas write \max(v, 0) for v so that the GPU can draw them: it does not take a logarithm of a value that could be negative.
These formulas use only the escape value. Other methods, such as distance estimation and stripe averages, use the whole orbit of each point, so they need more than this one number.
The cosine palette is from Inigo Quilez, the polynomial channels are from Solarian Programmer, and the triangle wave and the parity bands are from Junpei Sekino's page on coloring fractals.
JavaScript is required to view the interactive plot.