
Voronoi Diagram
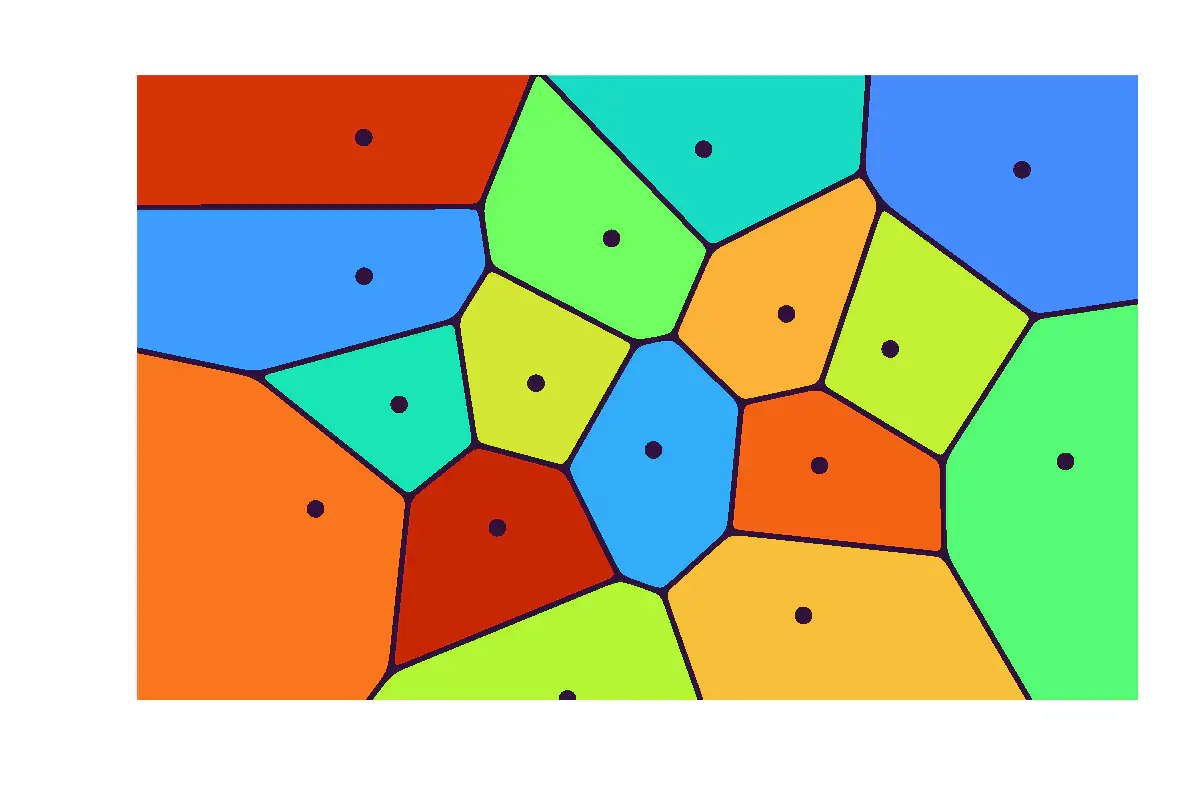
Sixteen drifting sites split the plane into colored cells: every point takes the color of its nearest site, with time animating.
A Voronoi diagram divides the plane among a set of points, called sites: the cell of a site is the set of points that are closer to it than to any other site. Each edge is a piece of the perpendicular bisector of two sites, and each corner is a point at the same distance from three sites. The same pattern appears in giraffe skin, dried mud, soap foam, the territories of animals, and the coverage areas of cell towers.
Here the 16 sites (p(k), q(k)) start on a sunflower spiral and each one moves on its own small figure-eight as the time T runs from 0 to 2\pi . D(x, y, k) is the squared distance from a point to site k , and F is the smallest of these. The weight n = e^{-5000(D - F)} is 1 for the nearest site and practically 0 for the others, so the averages u , v and H read the position and the color key of the nearest site without an explicit search. B measures how close the point is to the bisector with each other site, and the heatmap draws a dark edge where B is large and a dark dot where F is small. Everything is one formula of x and y , evaluated for each pixel on the GPU.
JavaScript is required to view the interactive plot.