
Contour Landscape
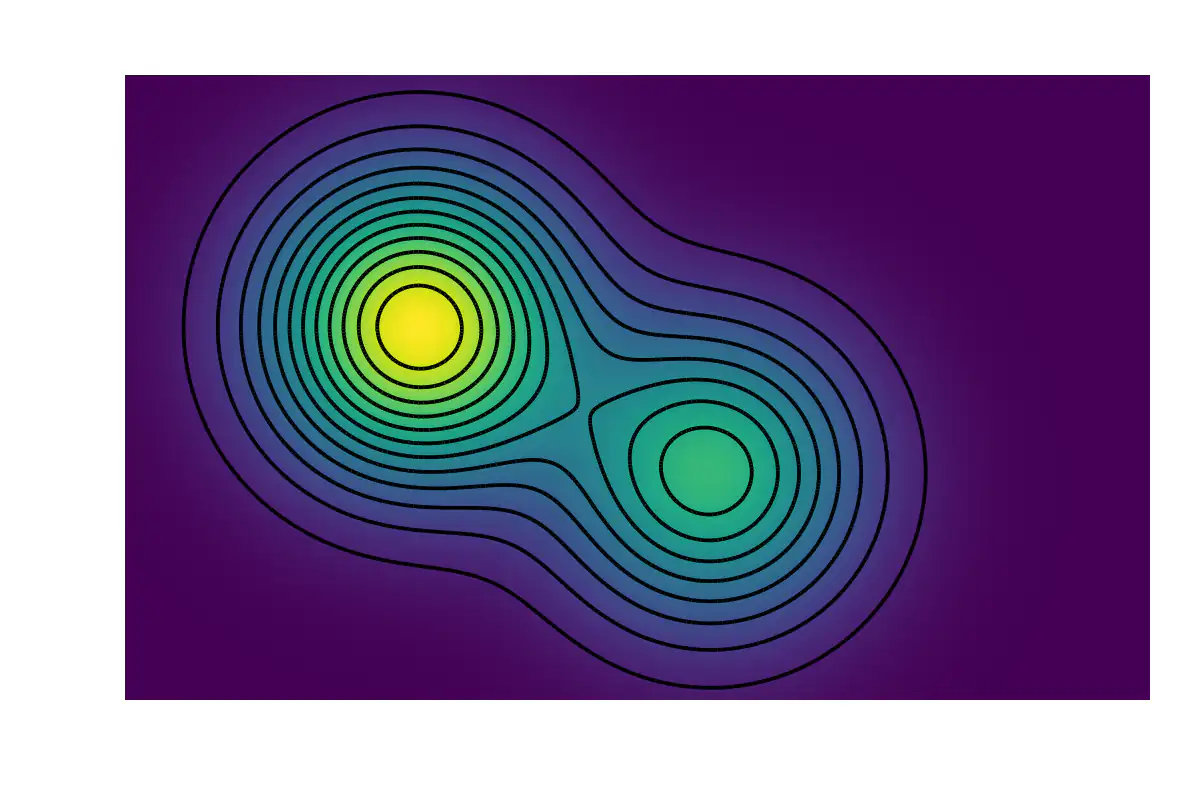
Elevation lines of a surface with two peaks and a saddle point.
A contour plot is a topographic-style visualization of a scalar field f(x, y) , drawing lines of equal value over the plane. Contour density encodes gradient magnitude: closely spaced lines mark steep slopes, while widely spaced lines indicate gentle terrain. The technique originated in 18th-century hydrography and cartography and remains the standard for weather maps, optimization landscapes, and any setting where height or potential varies smoothly across two parameters.
The field shown combines two Gaussian-like peaks, \exp(-(x-1)^2 - y^2) and 1.5\exp(-(x+1)^2 - (y-1)^2) . The second peak is taller, breaking the symmetry. A viridis heatmap encodes height continuously, and twelve contour levels trace lines of equal value across the surface. Close spacing around the peaks marks the steep flanks, while curving, more widely spaced contours between them outline the saddle-shaped col, a feature familiar from any two-summit mountain ridge.
JavaScript is required to view the interactive plot.