
Fourier Harmonics
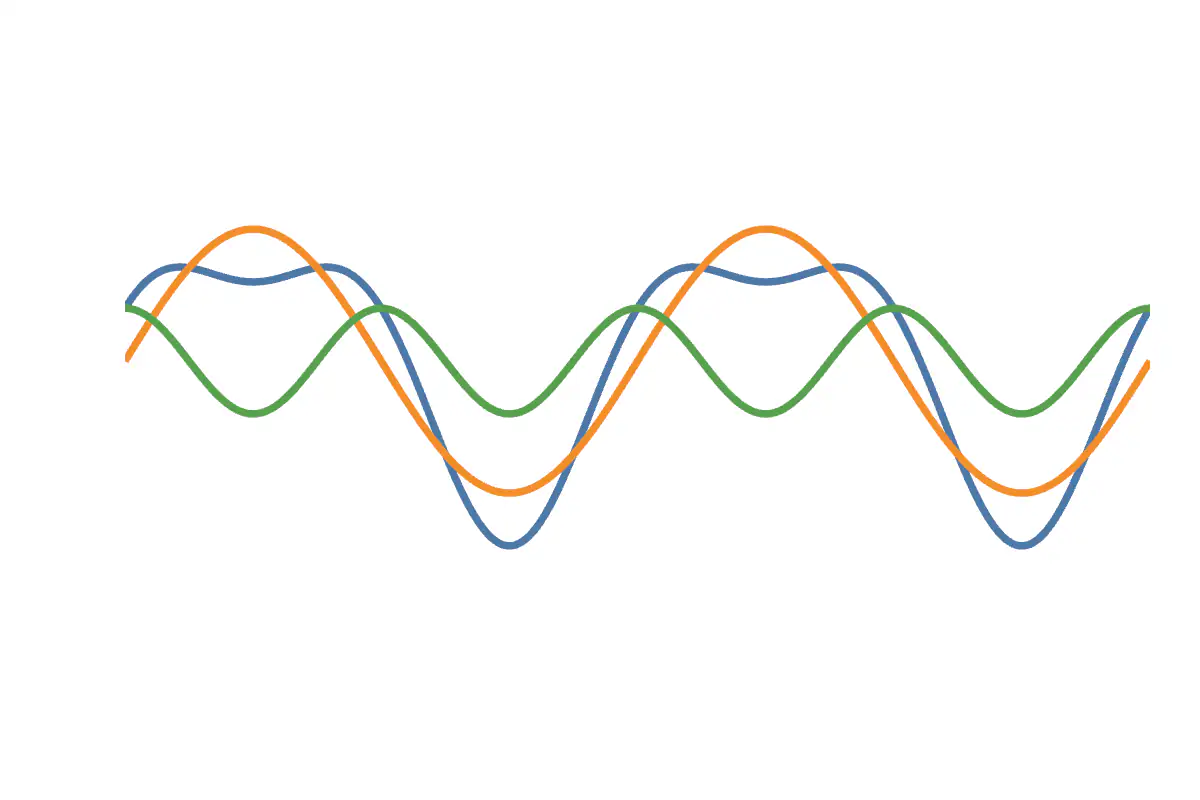
A composite wave with its individual harmonic components shown separately.
Fourier analysis, introduced by Joseph Fourier in 1822, expresses a periodic signal as a sum of sines and cosines at integer multiples of a fundamental frequency. Each component is called a harmonic. Decomposing a signal into harmonics underlies audio compression, image filtering, vibration analysis, and the physics of musical timbre — the reason a violin and a flute playing the same pitch sound different is the relative amplitudes of their harmonics.
The plot shows a simple composite wave, \sin(x) + 0.4\cos(2x) , together with its two component curves \sin(x) and 0.4\cos(2x) , all drawn over -2\pi to 2\pi . Plotted side by side, the second harmonic (twice the fundamental frequency, smaller amplitude) is visibly distinct from the base sine, and the composite shows how a higher-frequency term subtly reshapes each cycle without removing the underlying periodicity. This is the elementary building block of how arbitrarily complex waveforms can be assembled from simple sinusoids.
JavaScript is required to view the interactive plot.