
Bimodal Wait Times
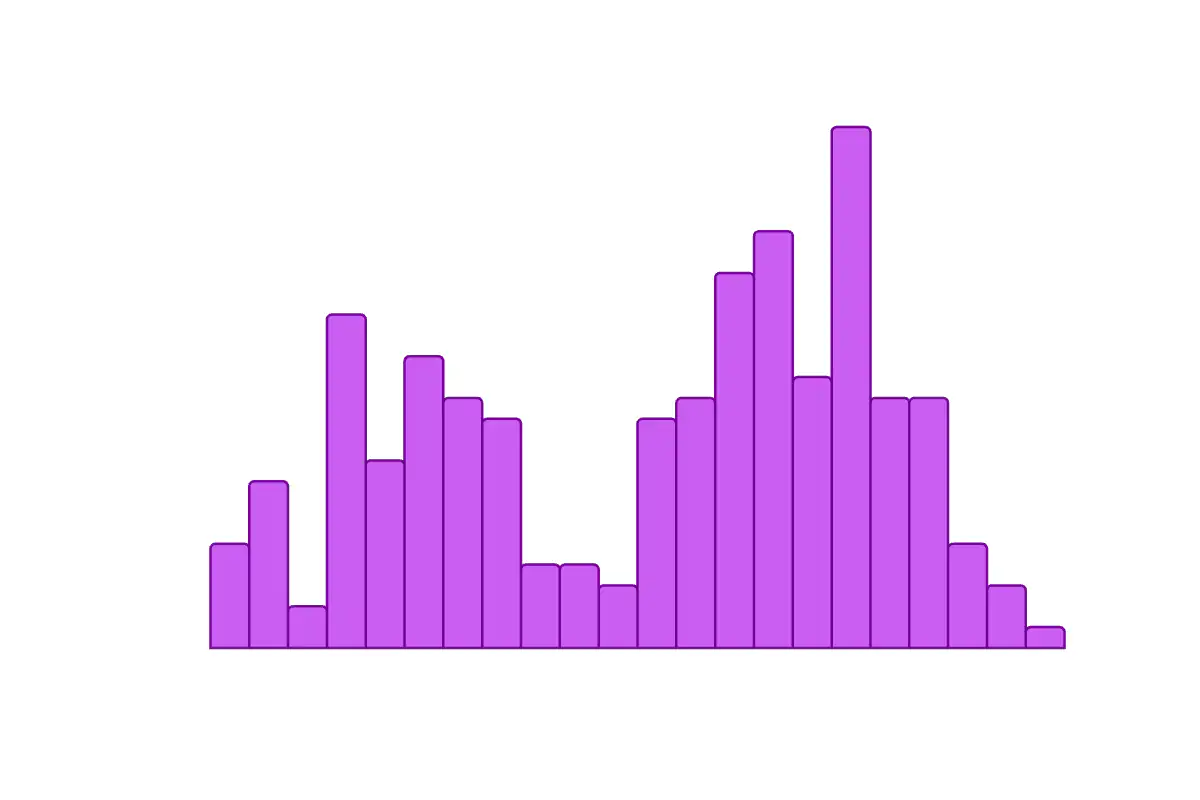
Geyser waiting times showing a clear bimodal distribution, modeled on Old Faithful.
Wait times between Old Faithful eruptions are a textbook example of a bimodal distribution. Rather than fluctuating around a single typical value, the waits cluster around two separated peaks corresponding to two distinct eruption regimes. Bimodal distributions arise whenever an observed population is actually a mixture of two underlying processes, and they routinely defeat models that assume a single dominant mode.
The visualization shows values drawn from a two-component mixture: one group centered near 54 minutes, the other near 80 minutes. The purple histogram uses 22 bins to make the bimodal structure unambiguous, and the two distinct concentrations are exactly the visual cue that motivates fitting a two-component Gaussian mixture model to this kind of data rather than a single normal distribution.
JavaScript is required to view the interactive plot.