
Iris Species
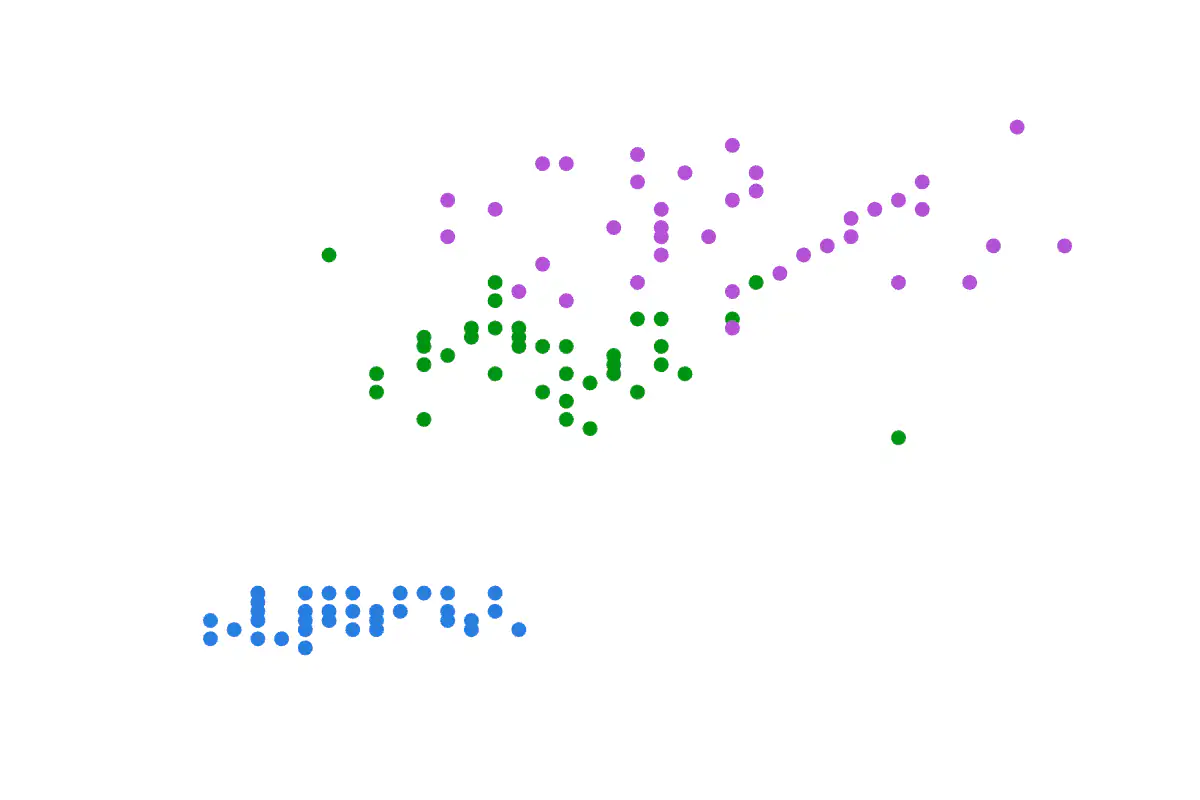
Sepal length vs. petal length for three iris species — Fisher's classic clustering dataset.
The Iris flower data set, collected by Edgar Anderson in 1935 and used by Ronald Fisher in his 1936 paper introducing linear discriminant analysis, contains four anatomical measurements for 150 samples spread across three species: Iris setosa, Iris versicolor, and Iris virginica. It is the canonical small benchmark in pattern recognition and clustering, and remains a standard teaching example for classification, dimensionality reduction, and visualization.
The visualization shows synthetic clusters modeled on the familiar measurements, plotting sepal length on the horizontal axis and petal length on the vertical axis. Blue, green, and purple points represent the three species. The setosa cluster sits clearly apart, while versicolor and virginica overlap — exactly the picture the original data shows, and the reason classifying the latter two species is non-trivial even though setosa is trivially separable.
JavaScript is required to view the interactive plot.