
Normal Distribution
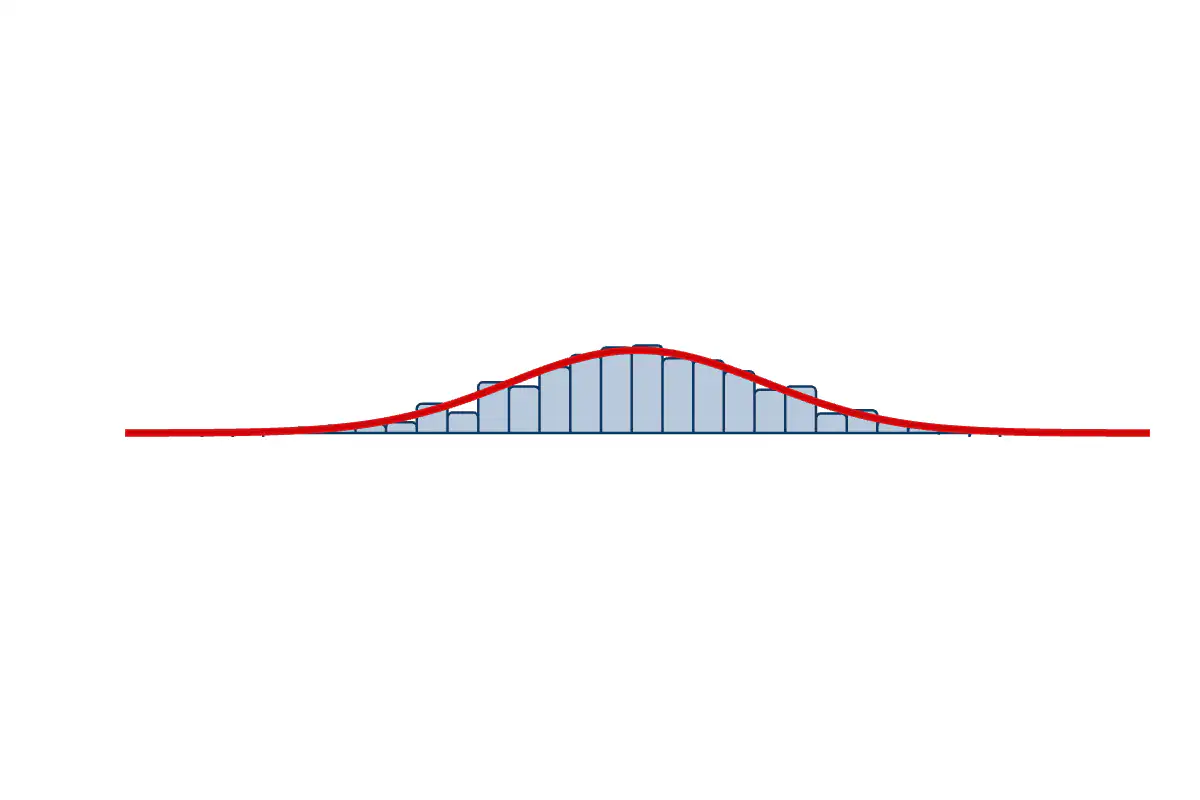
A density-normalized histogram of a Gaussian sample, with the analytic bell curve overlaid.
The normal distribution — also called the Gaussian distribution after Carl Friedrich Gauss, who used it in his 1809 work on celestial mechanics — is the bell-shaped probability distribution characterized by its mean and standard deviation. It is the limit distribution in the central limit theorem and the maximum-entropy distribution given fixed mean and variance. The normal arises everywhere measurements aggregate additively, including in physics, biology, economics, and machine learning.
The visualization generates 800 seeded samples from the standard normal (mean 0 , variance 1 ) and displays them as a density-normalized histogram with 28 bins. The red overlay is the analytic density (1/\sqrt{2\pi})\exp(-x^2/2) . Because the histogram is normalized to area one rather than count, its bars can be compared directly with the curve, illustrating sampling variation around the smooth theoretical shape and the basic logic of histogram-based density estimation.
JavaScript is required to view the interactive plot.