
Hertzsprung–Russell Diagram
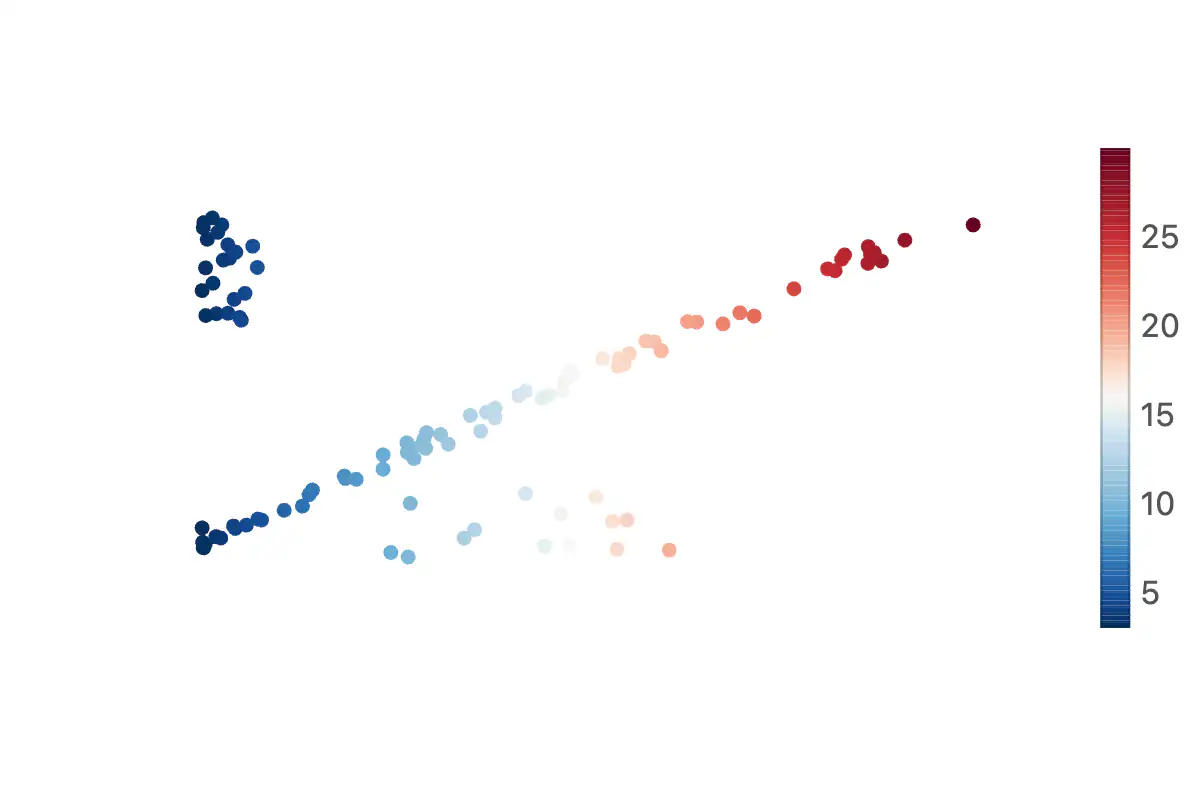
Stellar luminosity vs. surface temperature, with main sequence, red giants, and white dwarfs.
The Hertzsprung–Russell diagram, developed independently by Ejnar Hertzsprung in 1911 and Henry Norris Russell in 1913, plots stellar luminosity against surface temperature. It is one of the most important tools in modern astrophysics: a star's position on the HR diagram captures its current evolutionary stage, and the locus of points traced by a stellar population reveals the population's age and chemical history. The diagonal main sequence, the red giant branch, and the white dwarf clump are the diagram's three most recognizable features.
The visualization uses a synthetic scatter plot with temperature in kilokelvin on the horizontal axis and log luminosity on the vertical axis, with point color mapped to temperature via an RdBu palette and labeled in the color bar as T (kK). The simulated stars fall into the three classical groups: a broad main sequence, luminous cool giants in the upper right, and hot but intrinsically dim white dwarfs in the lower left.
JavaScript is required to view the interactive plot.