
Monthly Rainfall
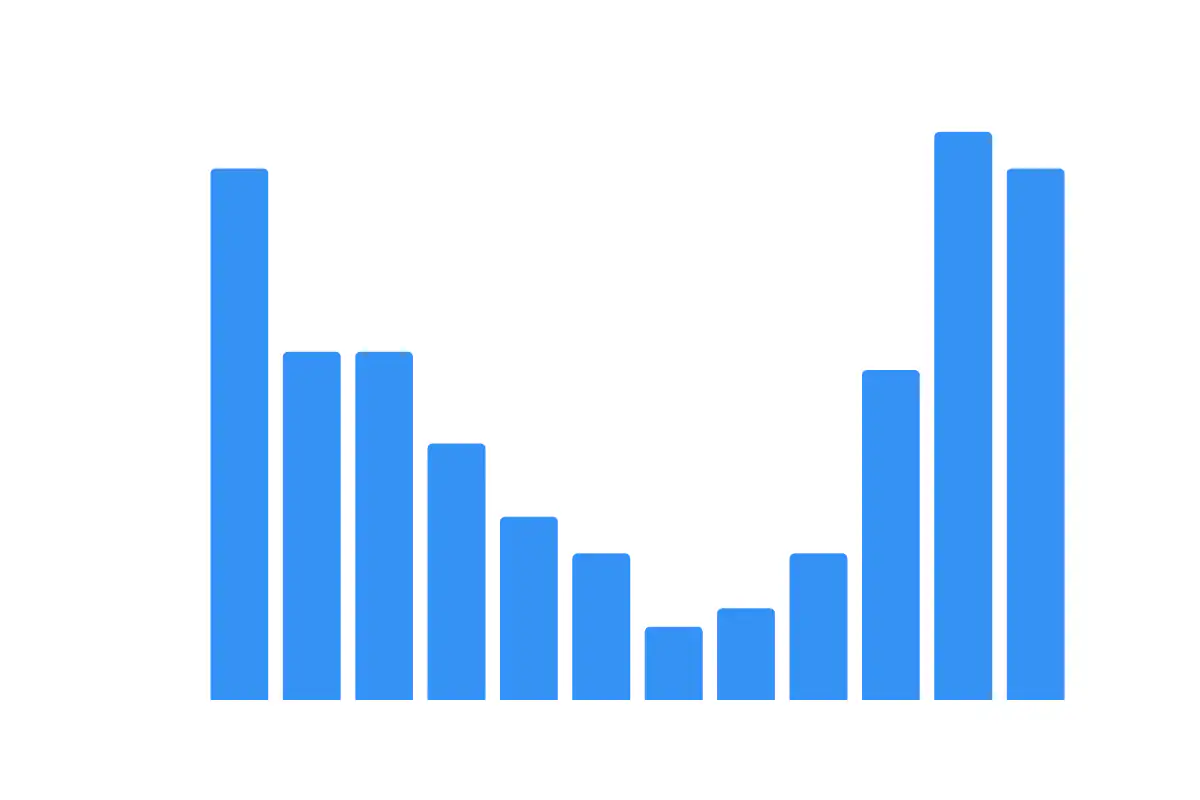
Average monthly precipitation in a temperate maritime climate, modeled on Seattle.
Monthly precipitation totals are a classic categorical time-series example: twelve discrete months, each with one summary value. Temperate maritime climates — the British Isles, the Pacific Northwest of North America, parts of New Zealand and Norway — share a recognizable pattern of wet winters driven by frontal storms and drier summers when subtropical high-pressure systems dominate. Reading off month-to-month precipitation lets students practice bar-chart literacy and seasonal reasoning before tackling continuous-time data.
The chart shows a synthetic year of average monthly precipitation modeled on a temperate maritime climate. Values are highest in late autumn and winter, decline through spring, and are smallest during the dry summer months. Each blue bar represents a single month from January through December, with bar height making the seasonal contrast immediate. Categorical rather than continuous spacing makes the comparison cleaner than a line chart would.
JavaScript is required to view the interactive plot.